- C. Lussana, F. Uboldi and M. R. Salvati, 2010.
A spatial consistency test for surface observations from mesoscale
meteorological networks.
Quarterly Journal of the Royal Meteorological Society, 136,
1075-1088. DOI: 10.1002/qj.622
- F. Uboldi, C. Lussana and M. Salvati, 2008.
Three-dimensional spatial interpolation of surface meteorological
observations from high-resolution local networks.
Meteorological Applications, 15, 331-345. DOI: 10.1002/met.76
See also: erratum
- presentation at EMS 2008extended abstract:
C. Lussana, M. Salvati, U. Pellegrini and F. Uboldi, 2009.
Efficient high resolution 3-D interpolation of meteorological variables
for operational use.
Advances in Science and Research, 3, 105-112.
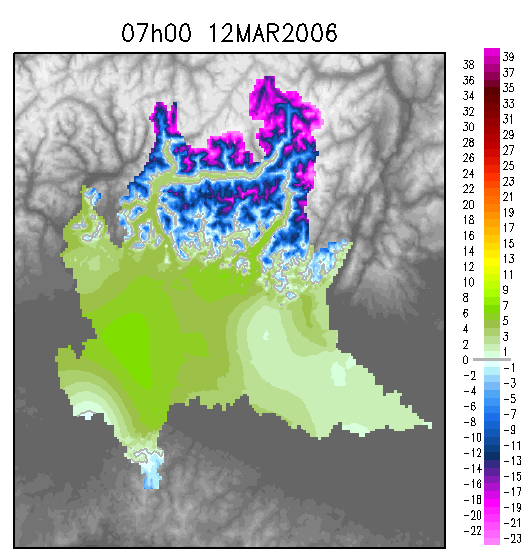
Lombardia is located in the southern side of the Alps. The grid box is
264 Km x 260 Km.
The grey tones show the orography, with the Alps in the North, the Appennines
in the South, and the Po Plain in the middle.
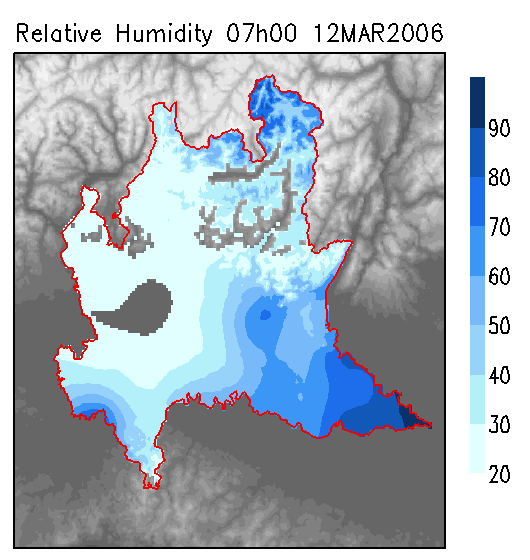
The maps show temperature (°C) and relative humidity (%) fields near
the surface in a north foehn case: 12 march 2006, 0700 UTC+1. The north
foehn affects the western side of the domain, both in Alpine valleys and
in the Po Plain, very dry with mild temperatures. The eastern side is under
the influence of a cyclonic circulation, with very cold temperatures recorded
in the mountain areas to the North-East and light snowfall observed (later
in the morning) to the South-East.
Observing stations are distributed in the domain with elevations ranging
between 0 and 3000 m amsl. Most of the Po Plain area is below 200 m amsl.
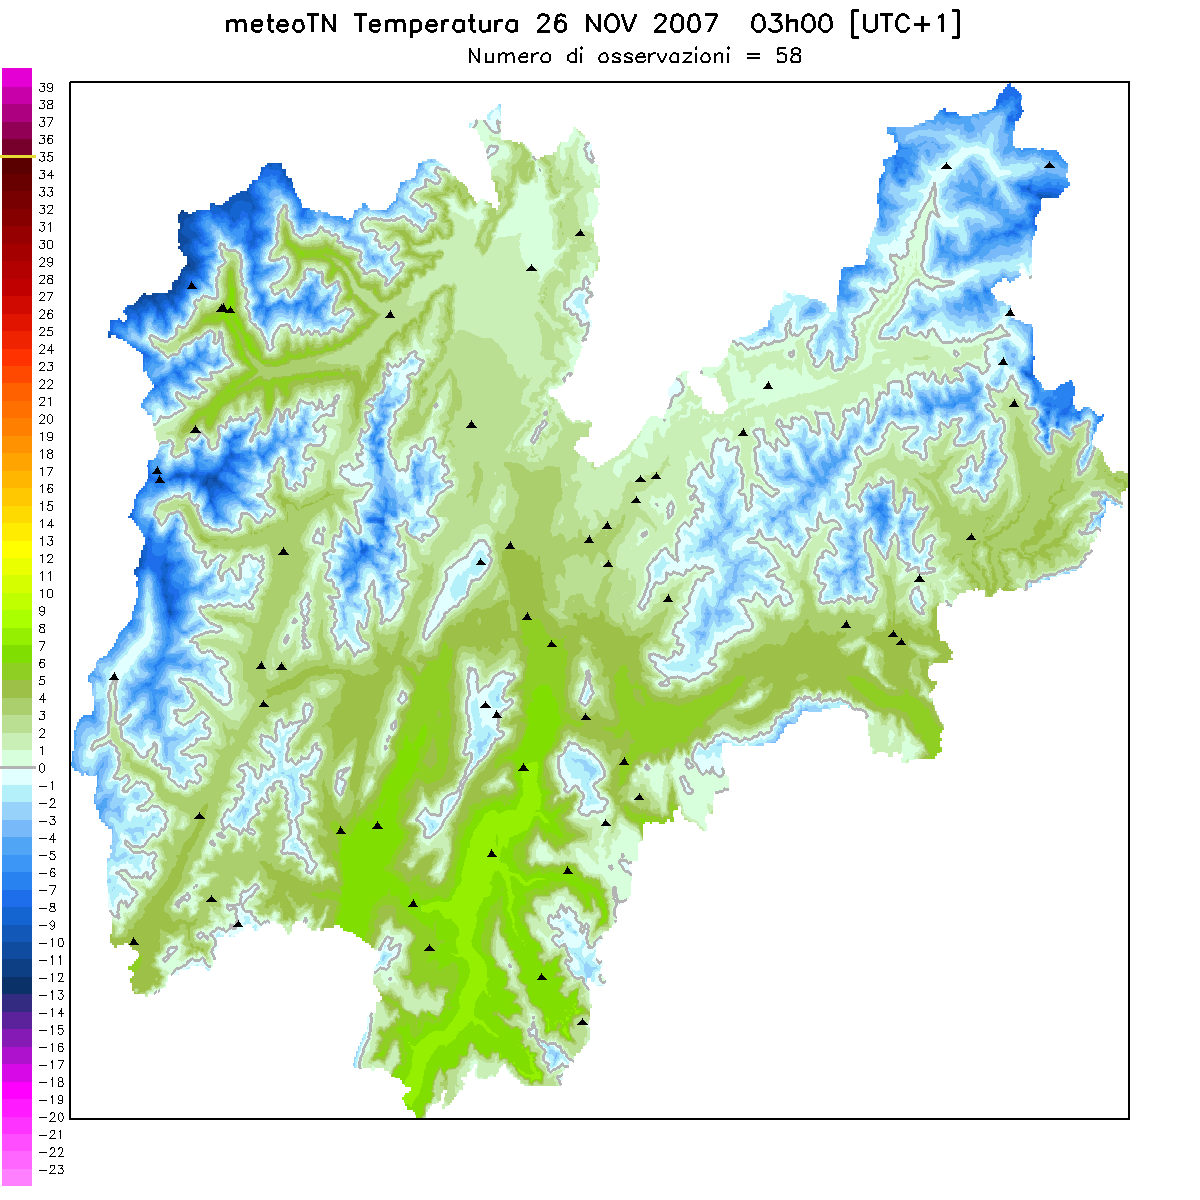
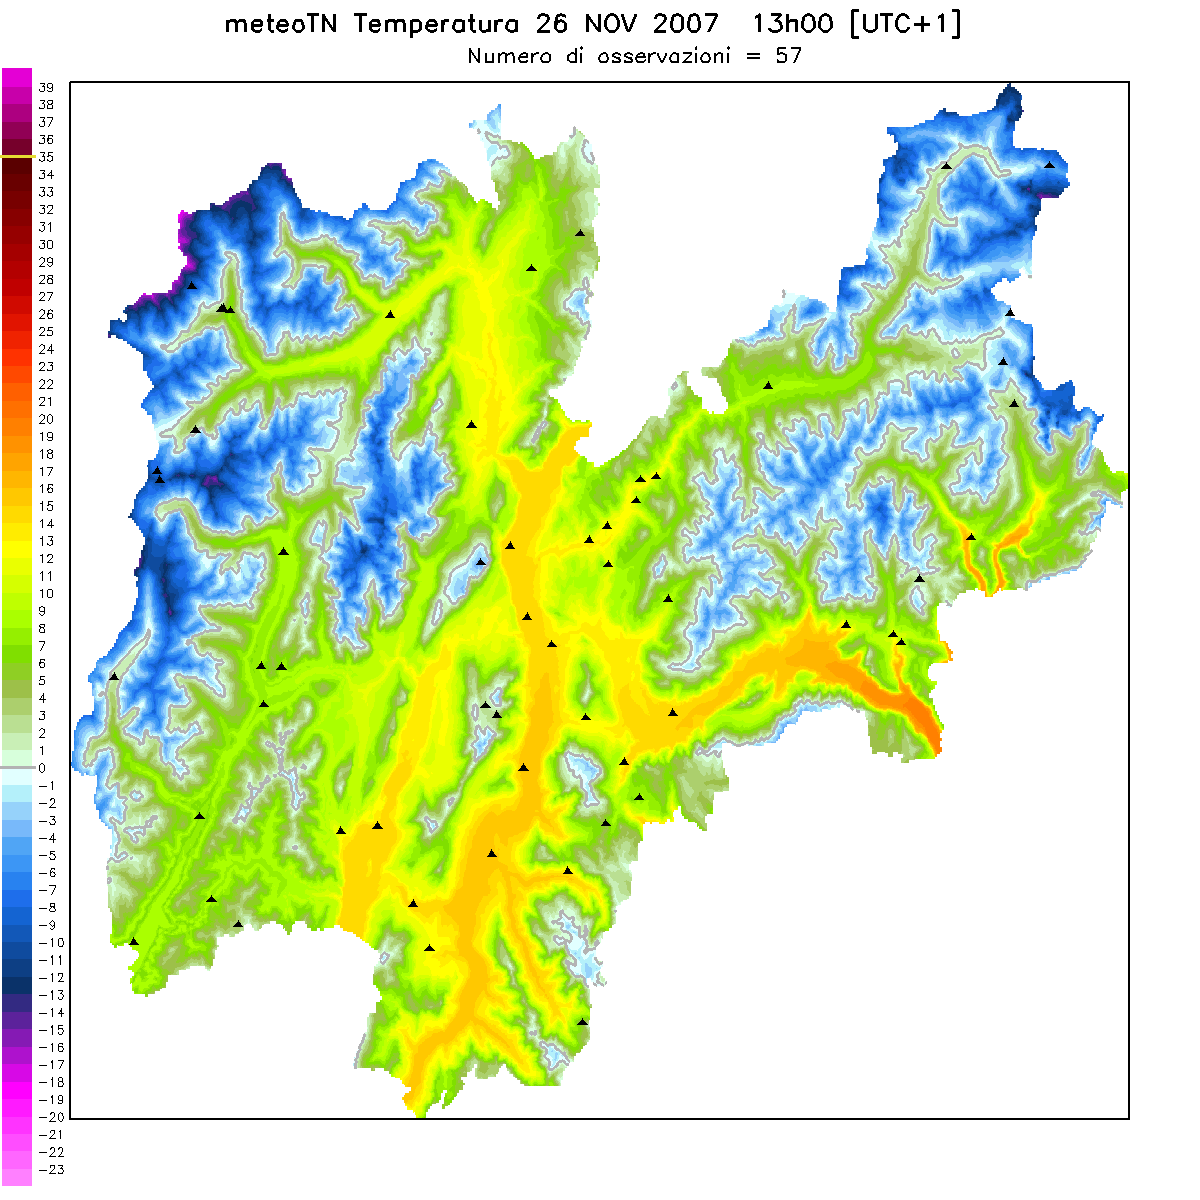
This smaller domain (gridbox 116 Km x 97 Km) is also in northern Italy, NE of
Lombardia. The whole area is in the Alps, the main valley is the Adige Valley.
These maps show the temperature (°C) field during the night
(left, 0300 UTC+1) and during the day (right, 1300 UTC+1) on 26 November 2007.
The station locations are marked in the maps as black triangles.